History often repeats itself. Those who forget history are doomed to repeat it’. These maxims hold equally true for investing, which is not solely about making quick decisions, but about understanding how various types of investments perform over time.
‘Gap’ In Long-Term Returns Of Different Asset Classes
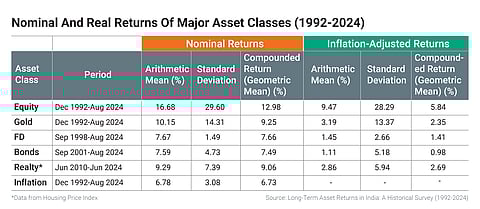
There is a significant gap in the nominal and inflation-adjusted returns across asset classes. So, reading long-term trends is important before making investing decisions

Advertisement
A study of mine on asset returns in India’s financial markets, titled, Long-Term Asset Returns in India: A Historical Survey (1992-2024), published on the Social Science Research Network, bit.ly/3PSBArw, throws up some interesting insights on major assets, such as equities, gold, fixed deposits (FDs), bonds, and real estate. The study consolidates data from different sources, enabling readers to explore trends and appreciate the risks and rewards of each asset, and make informed choices.
Findings
Each asset class tells a unique story over the past three decades.
Equities—Long-Term Winner, But Not Without Risk: Equities have historically provided the highest returns over the long term, averaging 16.7 per cent annually in nominal terms. But adjusted for inflation, they decrease to 9.5 per cent.
Equities also face significant drawdowns when their value declines sharply from a previous peak.
Over a rolling five-year horizon, equities have experienced real drawdowns in a quarter of all rolling five-year periods. But over rolling 10-year periods, they have recorded negative returns in one in 10 periods. This highlights the importance of remaining invested through lengthy periods to realise equities’ long-term growth.
Advertisement
Gold—A Reliable Safe Haven: Gold’s average annual returns of 10.2 per cent (nominal) and 3.2 per cent (real) highlight its role as a hedge against uncertainty. However, gold has also faced real drawdowns over a third of all rolling five-year periods and over a fifth of all rolling 10-year periods, a reminder that even safe-haven assets are not immune to losses over long periods.
FDs And Bonds—Stability With Drawbacks: FDs and bonds are widespread among investor portfolios because of the stability they offer in value, averaging nominal returns of 7.7 per cent and 7.6 per cent, respectively. Although they preserve capital in nominal terms, their purchasing power significantly diminishes during periods of high inflation, giving real annualised returns of just 1.4 per cent and 1.1 per cent over the study’s period. Moreover, they experience inflation-adjusted drawdowns in a quarter and a third of all rolling 10-year periods.
Equities have returned negative returns in one in 10-year rolling periods. This highlights the importance of long-term investing
Advertisement
While nominally stable, long-term portfolios that prioritise inflation-adjusted returns, such as retirement portfolios, must deliberate in their allocation to these asset classes.
Real Estate—A Mixed Bag: Real estate is often viewed as a stable investment, yet inflation-adjusted data reveals a different narrative.
Its nominal returns averaged 9.3 per cent, while the real returns were 2.9 per cent, according to data from the Reserve Bank of India’s (RBI’s) Housing Price Index. Real estate generated negative inflation-adjusted returns over a third of the time across all rolling five-year periods.
Key Takeaways
Inflation Is The Silent Wealth Killer: Inflation erodes the value of money over time. It also has a significant role in India, where the mean annual inflation rate was 6.8 per cent between December 1992 and August 2024. Though FDs seem safe, but their real returns are often close to nil or negative during inflationary periods. Even equities experience inflationary pressure, diminishing their purchasing power.
Advertisement
Retirement portfolios, which are conservative and consequently heavily allocated to FDs and bonds, are particularly vulnerable to inflation.
Drawdowns Show The Risks: A key finding of the study was the potential for extended real drawdowns across all asset classes.
Retirement portfolios, which are conservative and heavily allocated to FDs and bonds are particularly vulnerable to inflation
For instance, equities had a 164-month inflation-adjusted drawdown between 2007 and 2021, with a maximum drawdown of 64 per cent. Gold was down for 177 months in real terms between 1993 and 2008, with a 49 per cent maximum drawdown. Bonds had a lower maximum drawdown of 25 per cent, but experienced an even longer 180 months of real drawdowns between 2004 and 2019. These numbers are a stark reminder that there is no place to hide when inflation averages over 6.5 per cent and markets are volatile.
Long-Term Thinking Mitigates Short-Term Pain: While drawdowns are inevitable, the data shows that staying invested over longer periods significantly improves outcomes. For instance, equities recover and deliver strong real returns over 10- or 15-year horizons.
Advertisement
Compounding Is Not On Arithmetic Average Returns: Compounding is indeed the eighth wonder of the world, and several popular finfluencers take arithmetic averages and use them for compounding. Data from the study shows that just as inflation is a silent drag on returns, volatility is another silent drag on compounded returns.
For instance, equity had nominal mean returns of 16.7 per cent, accompanied by a standard deviation—a measure of volatility of returns—of 29.6. It delivered a compounded return of 13 per cent, which is 3.6 per cent or almost 22 per cent lower than the arithmetic average. Similarly, in inflation-adjusted terms, compounded returns were only 5.8 per cent, or 39 per cent below the arithmetic average of 9.5 per cent. So, one should reduce the arithmetic mean by half the square of the standard deviation to get a better estimate of compounded returns.
An important takeaway is this: if volatility is high, compounded returns will be significantly lower than arithmetic mean returns. This phenomenon is known as volatility drag, and Indian assets tend to exhibit higher volatility than similar assets in developed markets. Investors should pay close attention to volatility when they follow the old adage, “time in the market beats timing the market”.
Advertisement
Conclusion
This analysis of India’s asset markets shows the importance of understanding long-term trends rather than basing investment decisions on recent three- or five-year histories.
Unlike developed markets, India does not have a century’s worth of robust financial data. As the Indian economy evolves, studying these trends will provide more insights into building resilient financial plans.
Show comments
Published At:
Tags