Summary of this article
Annual Return shows a fund's performance for a single calendar year, from Jan 1 to Dec 31.
Trailing Returns (CAGR), are the most commonly used returns.
Rolling Return is the average of all possible returns over a specific time frame within a larger period.
Which of these three mutual funds would you choose to invest in?
Fund A: Annual Return of 24.7 per cent (for calendar year 2024)?
or, Fund B: 5-year trailing return of 23.32 per cent
or, Fund C: 5-year rolling return of 18.45 per cent (as on November 5, 2025)
All three types of returns belong to the same fund – Parag Parikh Flexi Cap Fund, which is the largest actively-managed mutual fund managing assets over Rs 1.19 lakh crore as of September 30, 2025. This immediately proves that the question of which fund is better based on these disparate returns is invalid.
But, this difference in return figures leads to the crucial question: If you invested Rs 1,000 in the fund, did your money actually grow to Rs 1,230 or Rs 1,845 or Rs 1,246 after a year?
The answer lies in understanding the three major types of returns used in the mutual fund industry: Annual Returns, Trailing Returns (also known as Compounded Annual Growth Rate, CAGR), and Rolling Returns. Each tells a different part of the fund's story, and investing on the basis of only one may lead to poor investment decisions. So, let's understand these three types of mutual fund returns in detail one by one.
Annual Returns: The Calendar Year Snapshot
The Annual Return simply shows a fund's performance for a single calendar year, from January 1 to December 31.
It is a straightforward calculation based on the Net Asset Values (NAVs) at the start and end of the year.
Net Asset Value is the per-unit market value of a mutual fund, calculated by dividing the fund's total assets minus liabilities by the number of outstanding units. In simpler words, it shows the price at which investors buy or sell fund units.
Coming back to understanding annual returns, we need the NAVs of Parag Parikh Flexi Cap Fund as at the beginning and end of the year 2024. The NAVs are as follows:
Closing NAV as of December 31, 2023: 70.2435
Closing NAV as of December 31, 2024: 87.6730
Now, we just have to run them through a simple formula to get the percentage change in the price of the fund.
Formula: (P1 - P0) / P0 *100
P1 is NAV as at the end of the calendar year
P0 is NAV as at the beginning of the calendar year or the end of the previous calendar year
Inserting the value gives us 24.81 per cent. And that is how we arrived at the annual returns of Parag Parikh Flexi Cap Fund for the calendar year 2024.
Now, annual returns are useful for gauging performance over specific market periods and help you see how the fund fared during different market cycles. It can be one of the important data points to understand how consistently the fund has performed over different market cycles, year after year.
However, annual returns fail to show the returns for common investment time frames (like 5, 7, or 10 years). More critically, annual returns do not show the impact of compounding, which is vital for long-term equity investing.
Now, that is where trailing returns come into the picture.
Trailing Returns (CAGR)
Trailing Returns, also known as the Compounded Annual Growth Rate (CAGR), are the most commonly used returns. The 23.32 per cent figure in the example we use at the beginning of this article is the 5-year trailing return.
It shows the average yearly growth between two specific dates - the start date and the end date. This is why they are often called Point-to-Point returns.
Now trailing returns calculate the return for any desired time period (5 years, 10 years, etc.) and correctly incorporate the effect of compounding. Why do we say so? Well, because they show how an investment's value has grown each year on average, considering that each year's gains also earn returns in the following years.
But a major drawback of trailing returns is that it hides volatility. As a point-to-point return, CAGR completely fails to capture the fluctuations or volatility in the fund's performance during that period. Let's understand with an example.
Suppose there are two funds. Fund A and Fund B both showcase a similar 5-year CAGR of around 11.2 per cent and 11.6 per cent, respectively. Now, if you have to select one fund, most of you would simply select Fund B, which shows slightly higher returns, or you may be indifferent since the difference is small and the returns are similar.
Now, look at the table and the return pattern of Fund A and Fund B over the five-year period.
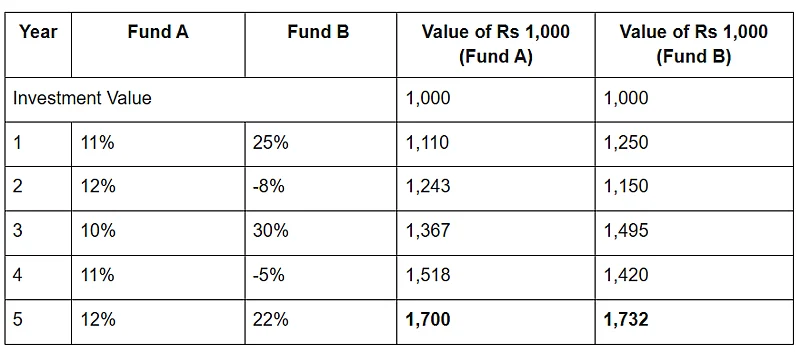
So, while both funds have a similar CAGR, their performance appears identical at first glance. However, Fund B achieved those 11.6 per cent returns despite experiencing wild market swings (high volatility), which can be highly stressful for investors. Fund A, on the other hand, was much smoother (low volatility) and delivered similar returns of 11.2 per cent.
Digging deeper shows that you would be better off with the less volatile Fund A that earns you similar returns with far lower risk. Fund A offers predictability, allowing investors to sleep soundly. Fund B, however, demands high risk tolerance; an investor might panic and sell after the devastating 30 per cent drop in Year 2 itself.
This phenomenon highlights the primary limitation of CAGR, which is a smooth, annualised figure that entirely ignores the path the returns took, known as volatility.
Now this is where it becomes essential to look at Rolling Returns.
Rolling Returns: The Consistency Metric
Rolling Returns is a very powerful tool for assessing a fund's consistency and risk. They capture the volatility that CAGR misses.
Rolling Return is the average of all possible returns over a specific time frame within a larger period. For example, to find the 5-year rolling return over the last 10 years (2015 to 2024), you calculate the return for every single 5-year period in that decade (e.g., 1st Jan 2015 to 31st Dec 2019, 2nd Jan 2015 to 1st Jan, 2020, and so on, which can result in over a thousand different periods) and then take the average.
To put it in simpler terms, rolling returns are like making a daily SIP for a certain interval and then averaging all those outcomes. They tell you – no matter when you invested for a 5-year period in the last decade, what was your likely return?
Additionally, while working on the rolling returns data, you can find out for how many periods a scheme gave positive returns and for how many it was in the negative zone. Also, you can find out how many periods a scheme beat the inflation.
You can also determine the maximum and minimum returns a scheme has provided over a five-year period, spanning 10 or 15 years. This will give you an idea about the probability of events happening in future.
The Volatility Test: Now, using the Parag Parikh Flexi Cap Fund example, the 5-year rolling returns revealed that out of 1,233 five-year investment instances in the 10-year period, the fund never delivered a negative return. Furthermore, 69 per cent of the time, the returns were between 10 per cent and 20 per cent. Now, this granular data proves the fund's consistency, the data that the single 23.32 per cent CAGR figure simply cannot provide.
CAGR vs Annual Returns vs Rolling Returns: Which is the best way to look at Mutual Fund Returns?
Well, no single return metric is perfect.
Annual Returns and Rolling Returns are excellent for gauging volatility and consistency, but rolling returns, especially, are not commonly available in the public domain easily.
Trailing Returns (CAGR) is best for showing the compounding effect and is easily available to the public.
Ultimately, while selecting a mutual fund, you should not be biased toward any one type of return. An informed decision requires you to look at all three types of returns wisely to get a complete, accurate picture of the fund's performance, risk, and consistency over different time frames.