As the mutual fund industry expands rapidly, so do investors’ expectations. They now want optimal returns, and the industry is responding by offering a plethora of options in terms of product offerings.
While more options mean more opportunities, they can also make decision-making that much difficult. Two critical choices now dominate every investor’s mind—choosing between active and passive, and between direct and regular plans.
Both choices boil down to one key question: which option gives you better returns? Let’s find out more.

1 April 2026
Get the latest issue of Outlook Money

Direct Vs Regular Plans: In a direct plan, you invest directly with the fund house without going through a distributor or advisor. This means that the fund house doesn’t incur distribution costs, and the savings are passed on to you in the form of a lower expense ratio and, ultimately, higher returns. Regular plans, by contrast, are sold through intermediaries who earn commissions, which lead to a higher expense ratio and lower returns for the investor.
But do direct plans really offer higher returns than regular plans? We ran two sets of numbers—one with a fund with a higher assets under management (AUM) and the other with a fund with a lower AUM, given that funds with higher AUM, typically, have a lower expense ratio compared with those with a lower AUM.
We found that direct investments have delivered higher returns. For instance, an investment of Rs 5,000 per month over the past 10 years in Baroda BNP Paribas Large Cap Fund, a low-AUM scheme, yielded 15.89 per cent extended internal rate of return (XIRR) for a direct plan and 14.53 per cent for a regular plan. XIRR measures returns by taking into account the exact timing and amounts invested at different periods. Over this period, a total investment of Rs 6 lakh grew to Rs 13.62 lakh in a direct plan, compared to Rs 12.68 lakh in a regular plan. The difference of Rs 94,638 shows the impact of lower expense ratios in direct plans over the long term.

We ran the same analysis for a high-AUM scheme, ICICI Prudential Bluechip Fund. Over a 10-year period with monthly investments of Rs 5,000 (totaling Rs 6 lakh), the direct plan delivered an XIRR of 16.91 per cent, while the regular plan returned 16.16 per cent. The investment grew to Rs 14.39 lakh in the direct plan compared to Rs 13.82 lakh in the regular plan, resulting in a difference of Rs 56,505. This relatively smaller gap shows how funds with lower expense ratios tend to have a narrower difference in returns between direct and regular plans.
Active vs Passive: Over the last five years, passive funds have surged in size and popularity, giving rise to a debate on whether active funds are better or passive. One of the main reasons behind this debate is the underperformance of active funds compared to their respective benchmarks or their passive counterparts.
In active funds, fund managers try to outperform a specific benchmark through strategic stock selection and market timing. Passive funds, on the other hand, simply track a market index like the Nifty 50 or the Sensex. They don’t aim to beat the market, but rather to mirror its performance. These funds generally come with lower costs, which can translate into better returns for investors over the long run, especially when active managers fail to outperform.
The Number Story
As part of our annual fund ratings, we crunched the numbers to help you make informed decisions on active versus passive investment decisions. We focused on large-, mid- and small-cap categories to analyse how actively-managed funds performed against their respective benchmarks.
In the 15- and 12-year periods, only eight of the 21 actively-managed large-cap funds managed to beat the Nifty 100 TRI index. The number is extremely grim on a 10-year basis: only four out of 23 funds managed to beat the index. However, on one- and three-year basis, around 50 per cent funds managed to best the index: 15 out of 31 in one year and 16 out of 28 in three years. This number is better for direct plans. On 12 years basis (direct plans were launched in 2013), 14 out of 24 funds managed to beat the index. The situation is not different in other categories. However, the only thing consistent in our analysis is that if chosen carefully, some funds outperform. This trend highlights that it is important to have winning funds in your portfolio if you want index-beating returns.
What Should You Do?
Outlook Money’s India’s Best Funds 2025 list, powered by Morningstar India ratings, can play a crucial role in arming investors with information and analysis to help them evaluate funds.
Note that this is not an investment advisory; this exercise is only meant to help you better understand how the schemes you may have invested in or are planning to invest in are faring. It may also give you an insight in case you work closely with your advisor in terms of choosing a fund. The analysis along with the ratings will help you make informed decisions.
How We Did It
While Morningstar India rated the funds, we ran the rest of the numbers ourselves. We chose key categories in the equity, hybrid and debt segments.
In India, most individuals invest more in equity-oriented schemes. Therefore, we have included all the equity categories defined by capital markets regulator, Securities and Exchange Board of India (Sebi). But we excluded contra and dividend yield categories because the number of schemes in these are very less—three in contra and nine in dividend yield.
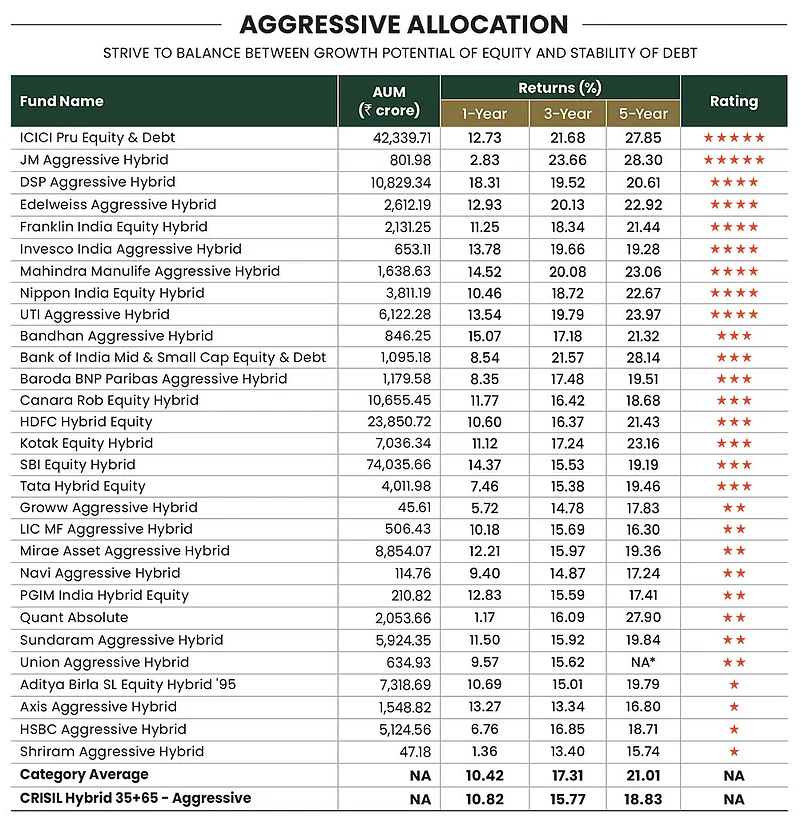
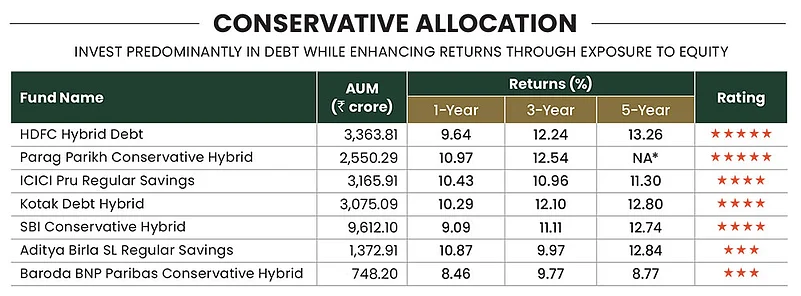
Hybrid funds are also becoming popular among retail investors, as they help balance out market volatility. We included three categories from hybrid funds, which have the maximum retail participation.
From the debt space, which is largely dominated by institutional investors, we have covered five sub-categories that cover the universe in terms of duration, which is the key to making debt fund investments.
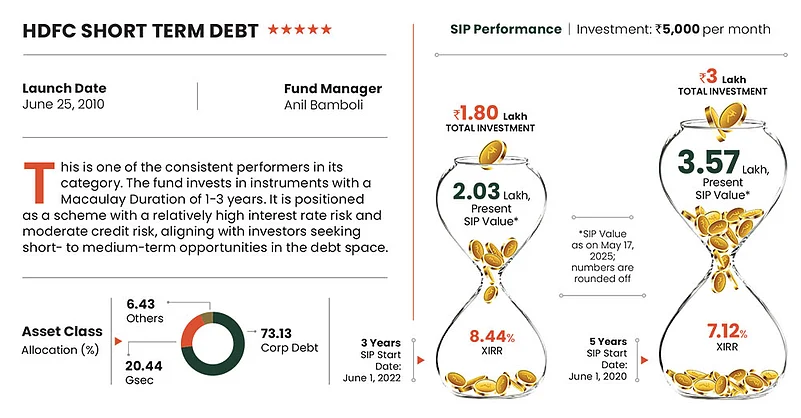
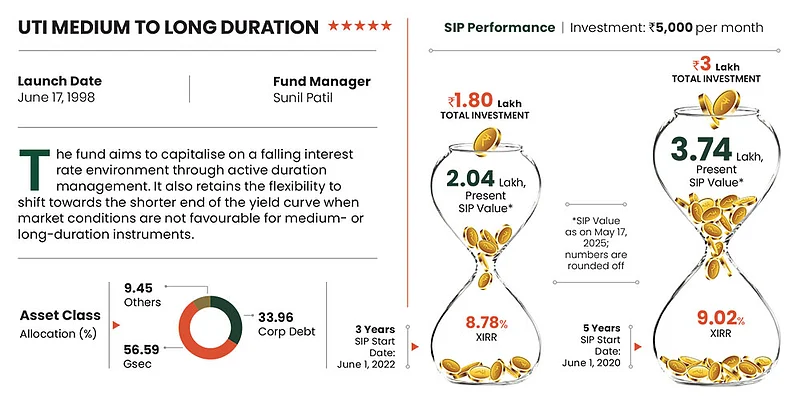
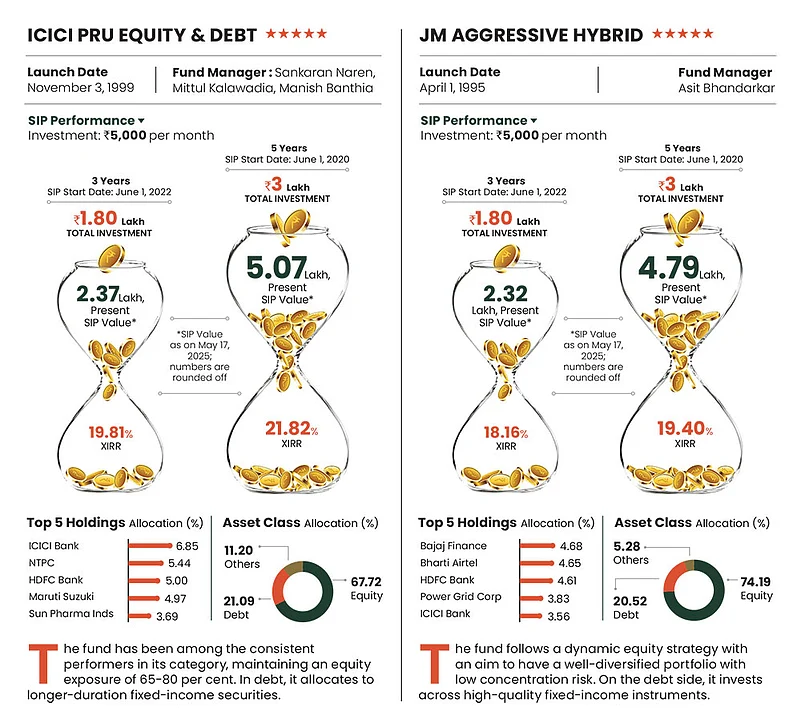
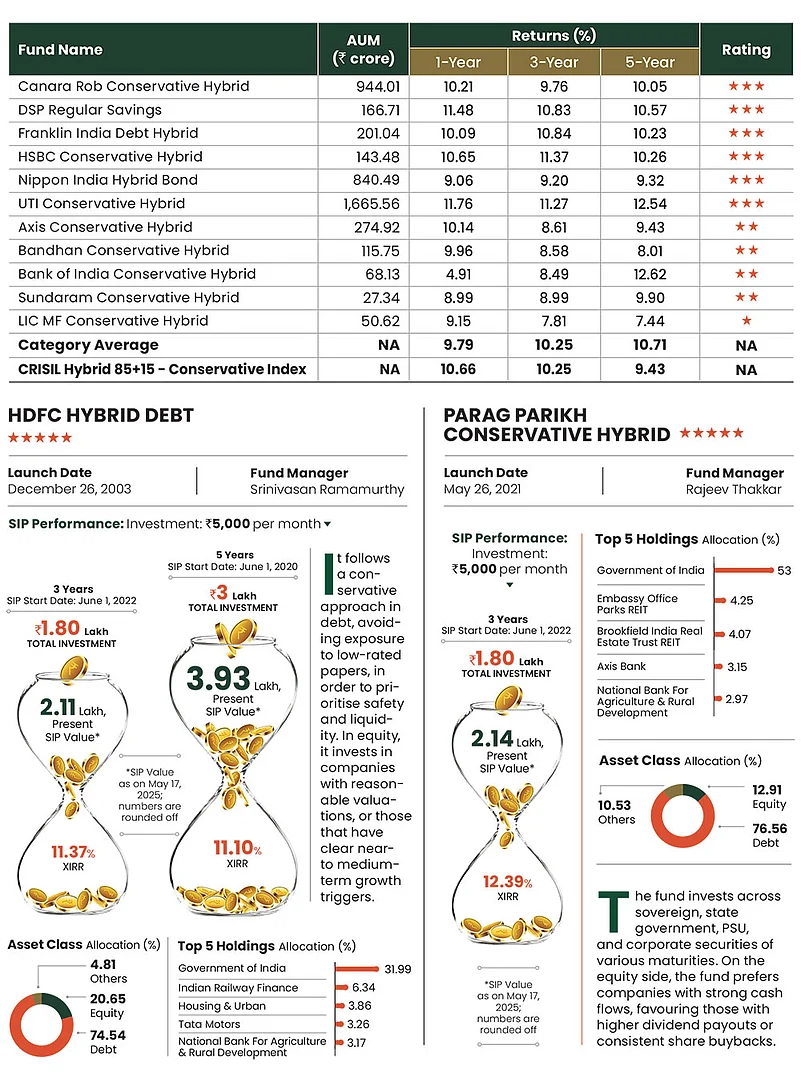
We went a step ahead to analyse Morningstar’s 5-star rated schemes in each category to show their SIP performance over three and five years.
Morningstar Rating Methodology
Outlook Money’s rating partner Morningstar India helped us rate mutual fund schemes with an investment track record of more than three years. The cut-off date for this exercise was March 31, 2025.
The ratings are based on the funds’ risk-adjusted returns. Morningstar uses three steps to calculate Morningstar Risk-Adjusted Return (MRAR). The calculations are done on a monthly basis first and then the results are annualised. Here’s the three-step process.
Total Return: This is the first step in which the monthly total returns for the funds are calculated.
Morningstar Return: At the second step, it calculates or collects monthly total returns for the appropriate risk-free rate. It then adjusts returns for the risk-free rate to get the Morningstar Return.
MRAR: The third step in the selection process is about adjusting the Morningstar Return for risk to get MRAR. Morningstar Risk is then calculated as the difference between Morningstar Return and MRAR. On the basis of these scores, Morningstar India then assigns the star ratings. Morningstar ranks all mutual funds in a category using MRAR, and the funds with the highest scores get the most stars.
Equity
Equity funds, which benefited from the market rally till the end of September 2024, faced significant headwinds later. Funds that took a more conservative approach fared better during the downturn. Companies with strong balance sheets, earnings, and robust business models were able to better cushion the impact.
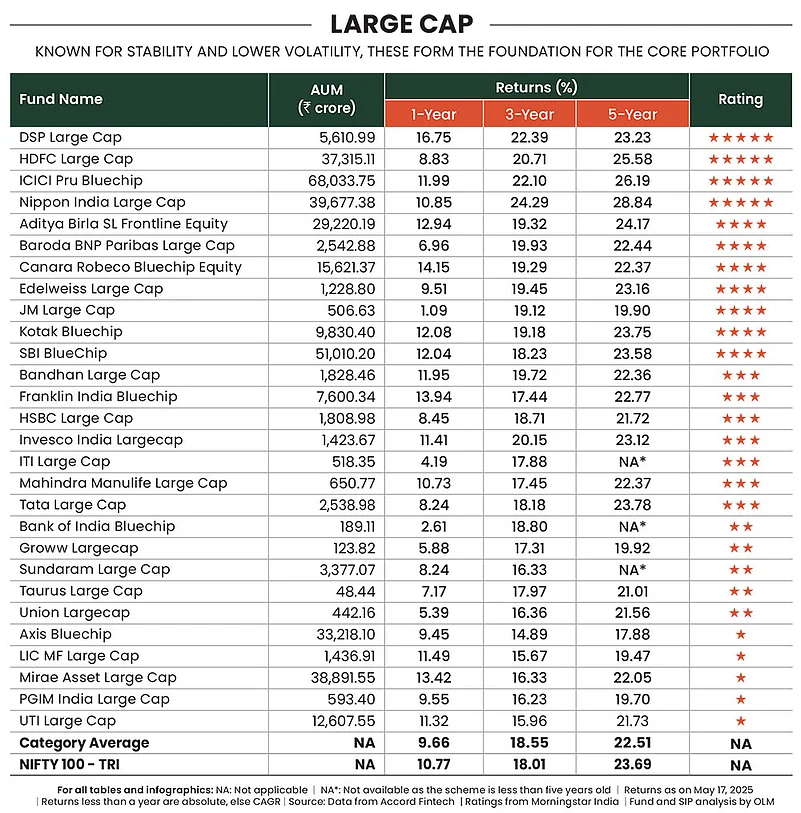
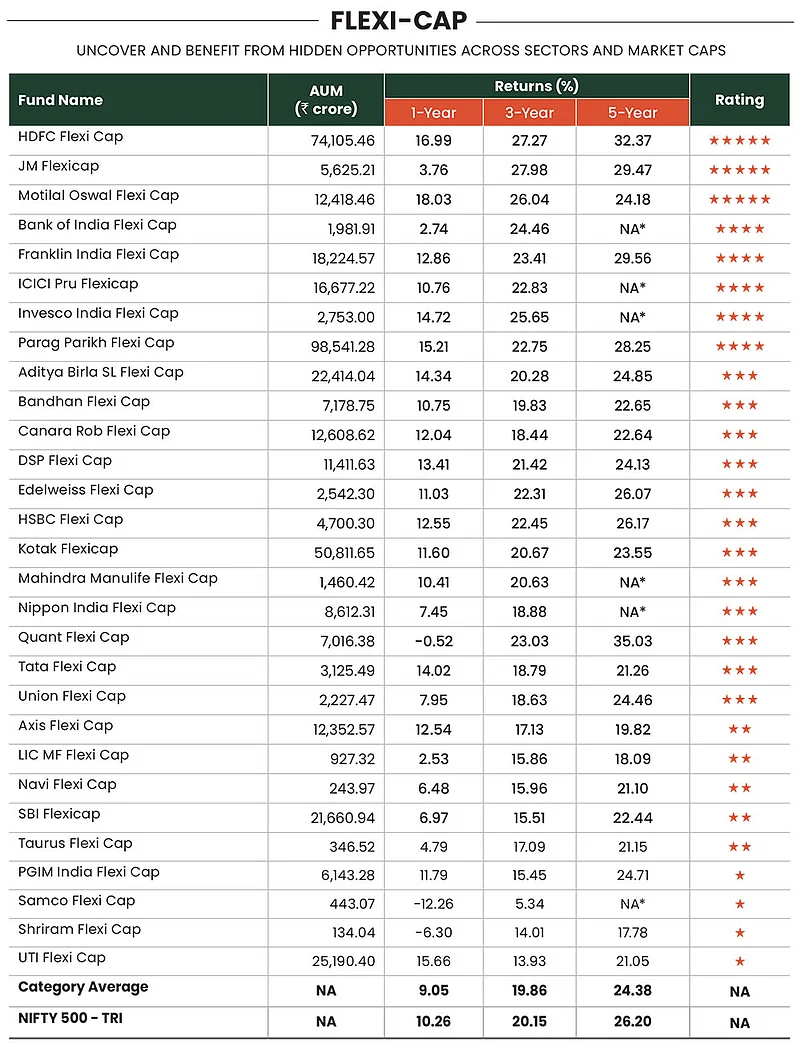
This led to the higher divergence in performance across all categories of equity funds. In the large-cap space, the difference in the best and worst performing—DSP Large Cap with 16.75 per cent and JM Large Cap with 1.09 per cent—is 15. 67 per cent. The highest divergence was seen in the flexi cap category (30 per cent). The best (Motilal Oswal Flexi Cap) gave 18.03 per cent, while the worst (Samaco Flexi cap) fell 12.26 per cent. In all, 18 out of 29 schemes selected managed to outperform the Nifty 500-TRI Index.
In the mid- cap space, only 11 out of the 25 schemes have managed to beat Nifty 150-TRI index.


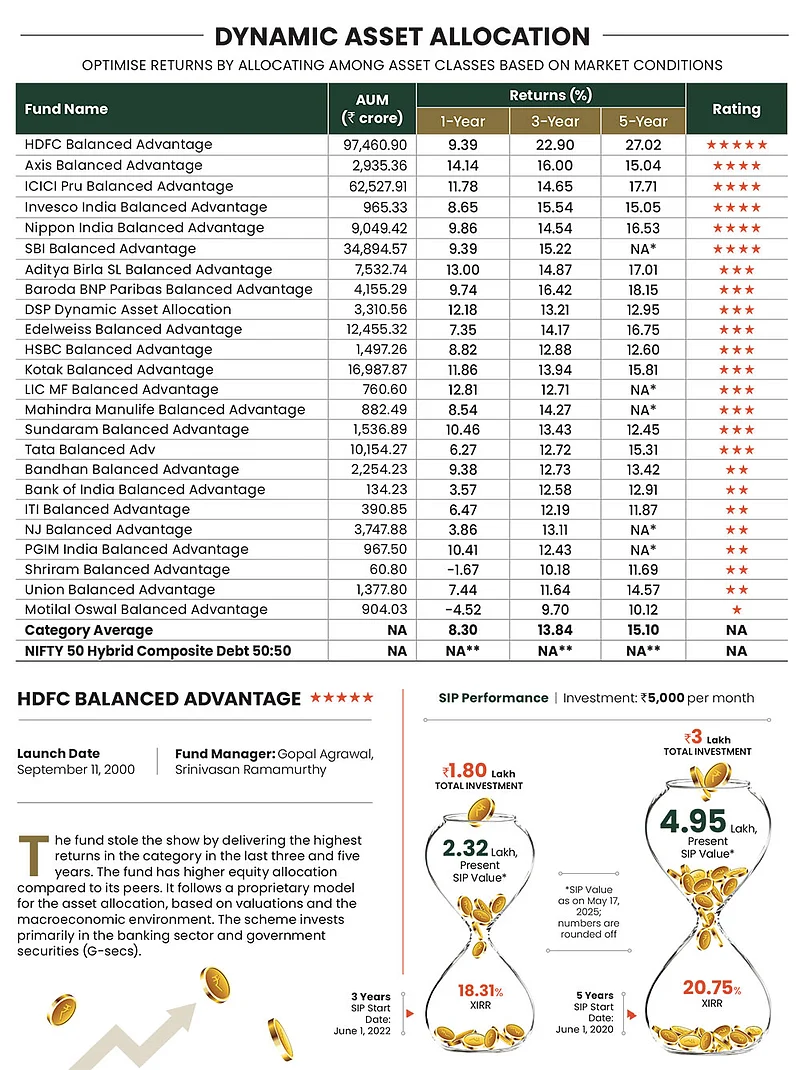
Balanced advantage funds (BAFs) which were dynamic enough to shift from equity to debt gained the most, while funds with higher equity exposure suffered. This category saw a high divergence in return. The best (Axis Balanced Advantage) gave 14.14 per cent returns, while the worst (Motilal Oswal Balanced Advantage) fell 4.52 per cent.
More than half of equity-oriented hybrid funds managed to beat the Crisil Hybrid 35+65–Aggressive index. Some of the funds with higher equity exposure in the mid- and small-cap space delivered higher returns compared to peers who chose to remain conservative. Typically, in a rising market, equity allocation boosts returns. So, funds with higher mid- and small-cap exposure secured top positions in the category in the last one year. The divergence in debt-oriented hybrid funds was relatively lower at around 7 per cent between the top and bottom performers.
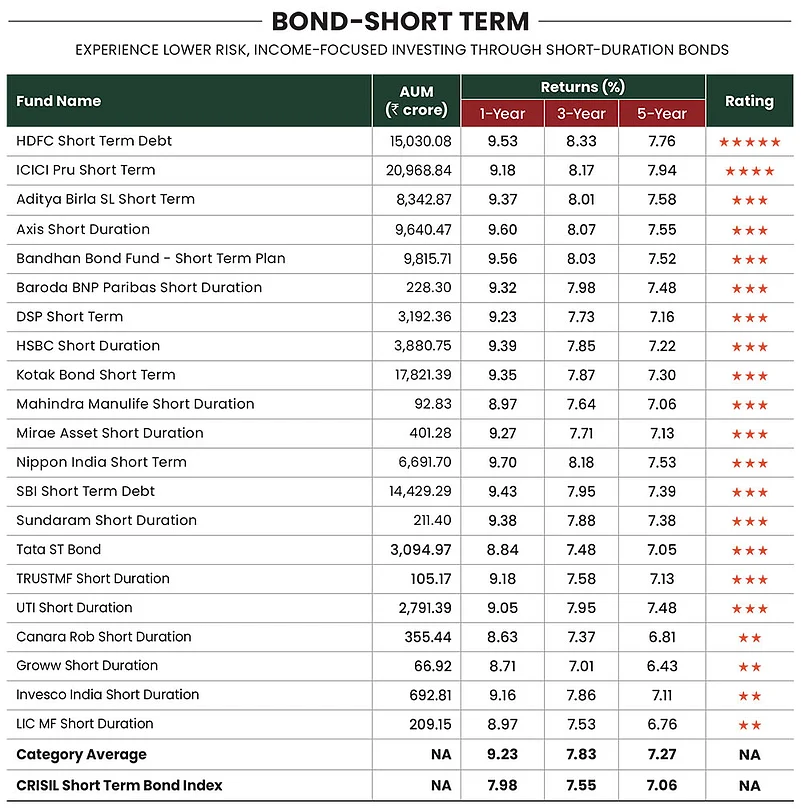
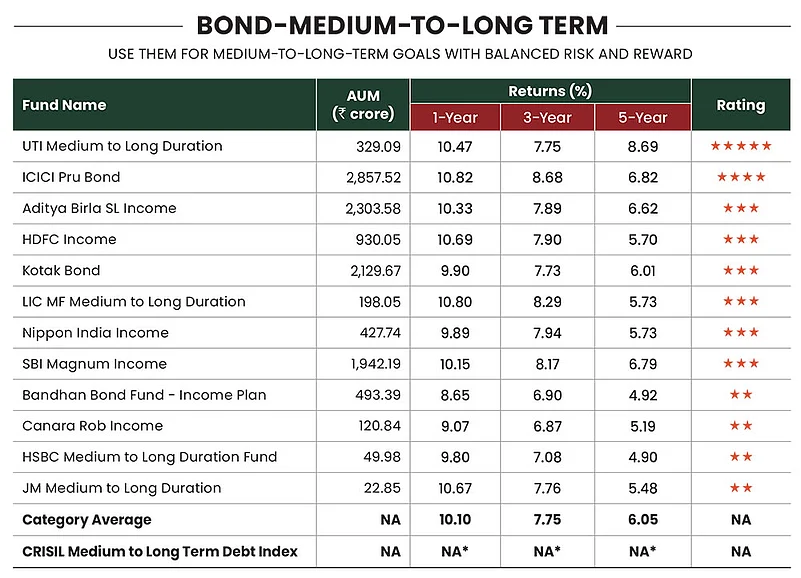
Debt
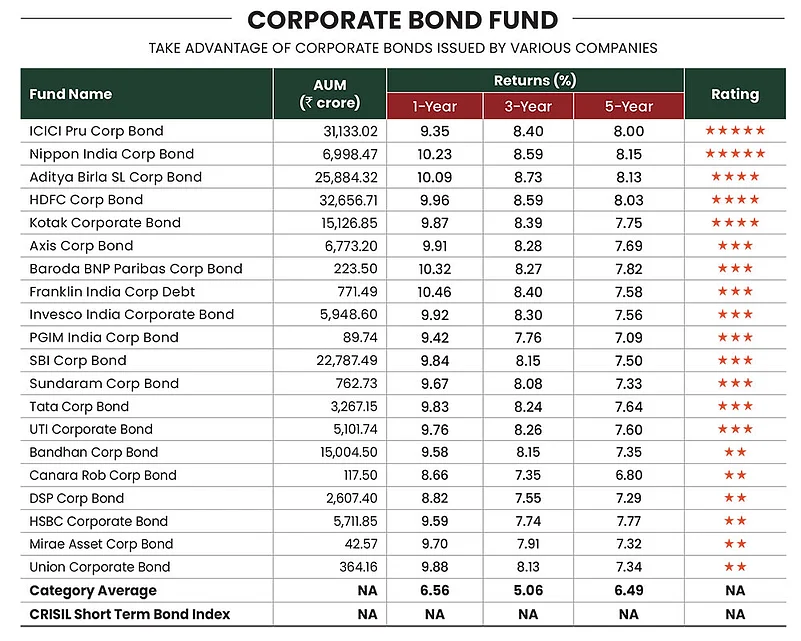
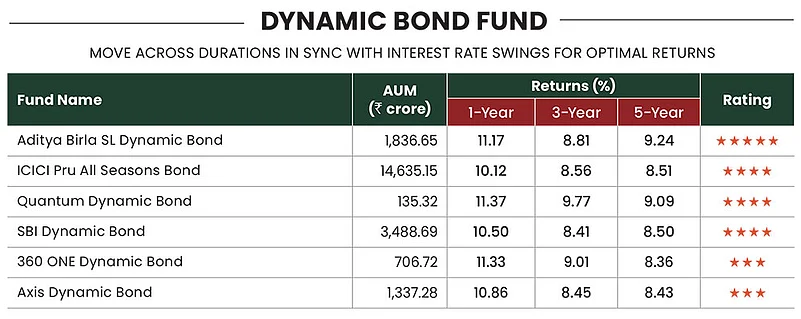
After a rollercoaster ride of the last few years, debt funds are in action after two rate cuts of 50 basis points (bps) by the Reserve Bank of India (RBI). Last year we advised our reader to invest into the right mix of short- and medium-term debt funds to take advantage of the emerging market scenario. Ditto to our analysis, these segments are real beneficiary of rate cuts. The average returns from the short-term category is 9.23 per cent, while that from the medium- to long-term category is 10.10 per cent for the same period. According to experts, bond markets are expecting deeper rate cuts of 50-100 bps over the next two quarters after the change in the monetary policy stance to “accommodative” and expectation of inflation coming in 40-50 bps below the average forecast of 4 per cent in FY26. We expect another 50 bps rate cut. Investors can continue to allocate to short-term and corporate bond funds with portfolio duration up to four years.