
You would have come across computation charts showing the differential between the expense ratios of direct plans and regular plans of mutual Funds, and how this differential compounds over the years and impacts your portfolio performance. The bigger the size of your portfolio, the higher is the compounded impact over the years. Yes, these computations are mathematically correct. However, things have to be seen in perspective. Choosing underperforming funds can change the picture.
To understand this, we are taking one year returns of mutual fund schemes. That said, it is to be seen as an example. Decisions should be based, not one-year returns, but long-term returns, preferably risk-adjusted returns over multiple market cycles.
Large-Cap Funds
1 July 2026
Get the latest issue of Outlook Money

The market went through a correction starting October 2024. Recovery happened, and for a while, we were in a phase of correction, with returns being stagnant for some time. Now, post recovery, one-year returns from the market look reasonable, at least beating bank fixed deposits (FDs) at the index level, though returns from specific stocks may show a different picture.
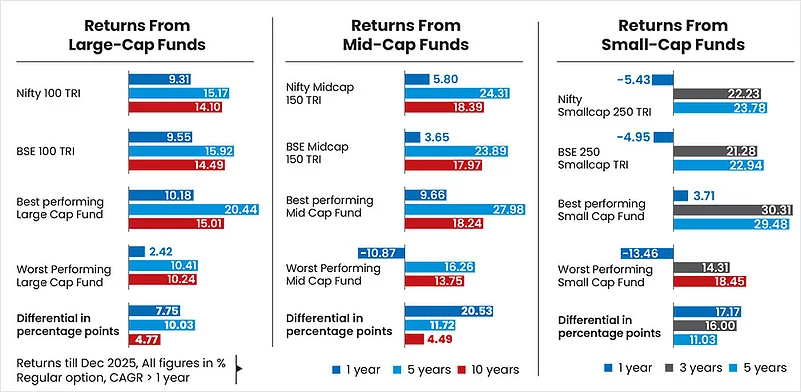
As the table (see Returns From Large Cap Funds) shows, over the last one year, while the market at the index level has delivered just under 10 per cent, the worst-performing large-cap fund has delivered only 2.40 per cent. The differential between the best and worst funds over the last one year is big, 7.75 per cent. Over the last five years, the differential between the best and the worst fund is stark, more than 10 per cent. If you are debating between regular and direct option, while the direct option does save you 0.50 per cent or 1 per cent per year, if you are stuck in bad-performing funds, you will take a bigger hit.
Mid-Cap Funds
Over the last one year, the differential between the best and the worst mid-cap funds is mind boggling. It is more than 20 per cent. Even at five years, this differential is huge.
The fund manager’s universe is limited to only 150 stocks. In a bid to outperform the index, active fund managers take calls in stocks with weightages different from that in the index. If the call does not come out successful, at least in the short term, it leads to underperformance.
Small-Cap Funds
The picture in small-cap funds is similar to that in mid-cap funds. Over the last one and three years, the differential between the best and worst is huge. In this category, while the fund manager’s universe for stock selection is wide, the companies are fundamentally not as stable as, say, for large-cap stocks.
The fund manager has to take a call and if the call comes out correct, there is outperformance against the index, and vice-versa.
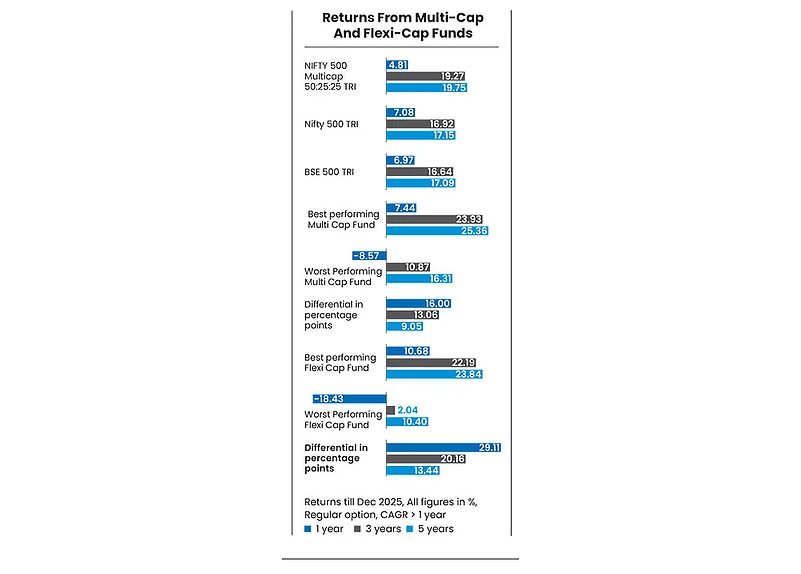
Multi And Flexi-Cap Funds
In both multi- and flexi-cap funds, the differential is stark. In multi-cap funds, the differential between the best and worst performing funds over a one-year period is 16 per cent. In flexi cap, it is over 29 per cent.
Investor Guidance
The point is that while we debate between regular and direct options, based on the advantage in total expense ratio (TER) of direct over regular, the choice of funds makes a bigger difference. But the big question is: Who will bell the cat? Can the advisor do it? Or can you, if you think you understand markets and go the do-it-yourself (DIY) way?
There is no definitive answer to that. But a professional is in a better position to guide you on the choice of funds. Like no one can catch the peak or bottom of the market, no one can predict the best performing fund. The perspective for a good performing fund is top quartile performance over a long-time horizon. So, if there are 20 funds in a category, a fund that features in the top five consistently across time horizons, is a winner. It is not possible for a fund manager to be the top performer in the category across all time horizons.
So far, we discussed the choice of funds in a given category. But theory states that the overall allocation in equity, debt, gold and categories within an asset class, such as large- or small-cap, or long- or short-duration bonds play an even bigger impact on your portfolio.
This theory was propounded by Brinson, Hood and Beebower. While the theory states that more than 90 per cent of your portfolio returns is explained by overall allocation to equity, bonds, and gold, it has been questioned by other experts. Yet, the essence of this theory is important. For instance, gold has given golden returns over the last one year. If you were focused on equity with nil allocation to gold, you would have missed it. The differential it would have made to your portfolio returns would be bigger than the differential in TER or direct and regular plans.
The other debate is between active and passive funds. For instance, in the small-cap category, on a five-year horizon, the worst performing fund has delivered 18.45 per cent per year. The relevant benchmark has delivered about 23 per cent per year and the best performing fund has delivered 29.48 per cent per year. Both ways, over a five-year horizon, it makes a significant difference against the benchmark. If you are fine with index level returns and don’t want underperformance (like 18.45 per cent) you may go for passive funds. If you prefer the alpha (like 29.48 per cent) you may take professional guidance or do your own research to pick the top quartile performers. Rather than “active vs passive” make it a combination of “active and passive” in your portfolio.
Prioritise your overall and category allocation, followed by fund choice—active, passive or direct or regular—to improve portfolio performance.
By Joydeep Sen, Corporate Trainer and Author