


Since roll out of the Unified Pension Scheme (UPS) on April 1, 2025, there have been debates around which pension scheme is better. While the two pension schemes are starkly different, where UPS offers guaranteed pension, NPS attracts with the chances of higher return due to market-linked investments, the comparison cannot be avoided. More so, because the deadline to select the pension option is June 30, 2025.
Needless to say, UPS’s most appealing feature is the guarantee it offers. No doubt a fixed and guaranteed pension provides the ‘peace of mind’ that a higher but ‘uncertain’ annuity cannot match.
While UPS and NPS features are clear and known but not the calculations. Most of the employees have not made up their minds yet because their decision is clouded with doubts about which scheme could be better for them.
Says Vivek S.G., a certified financial planner and founder of Wealth Crafts, a Securities and Exchange Board of India-registered investment advisor (Sebi-RIA): “Many employees may also be taking a 'wait and watch' approach to fully understand its long-term implications before switching from the market-linked NPS.”


He attributes the irrevocable nature of choice and lack of capital return for the delay in exercising the option.
Now, with the launch of UPS calculator by the government, comparing these two schemes has become easy.
According to Vivek, the calculator would help compare UPS and NPS using different assumptions, such as rate of return, annuity rate, age, etc. This would help potential takers to make an informed decision.
To understand which pension scheme can generate more return, let us take an example of a person who has been working for last 20 years and have accumulated some amount and one who has joined recently before two years.

Here are the assumptions.
For An Employee With 20 Years In Service:
• Age of employee: 45
• Date of joining: May 2005 (Qualified years of service are 35 years)
• Retirement age: 60
• Monthly Basic pay: Rs 50,000
• Existing NPS Tier 1 corpus: Rs 20 lakh
• Annual Basic pay growth rate: 5 per cent
• Annual DA growth rate: 3 per cent
• Expected return on investment: 8 per cent and 10 per cent
• Final Lump sum withdrawal percentage: 60 per cent
• Annuity rate after retirement: 6.5 per cent
• Life expectancy: 80 years
• Surviving spouse's life expectancy: 80 years
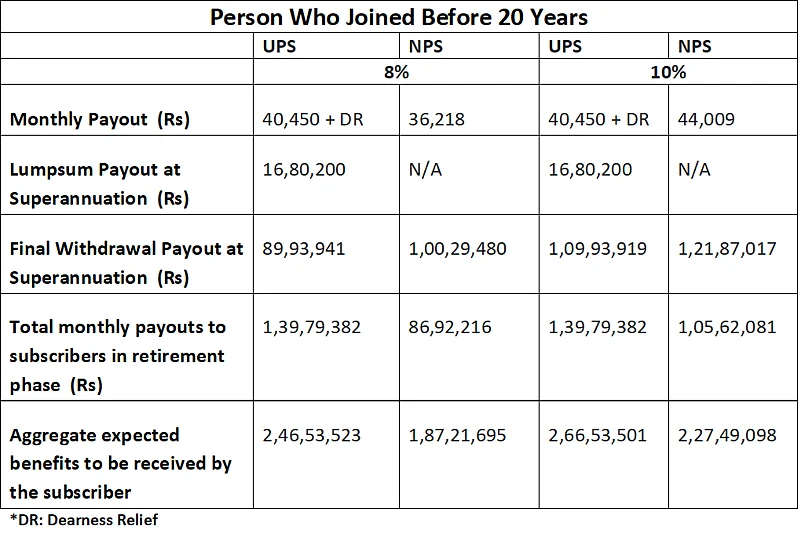
The calculator shows that in both cases the aggregate benefits are higher in UPS compared to NPS. However, at a higher rate of return the difference becomes narrow. It indicates that if rate of return would get higher, it would increase NPS’s aggregate benefit more than UPS.

For An Employee Who Joined The Service Two Years Ago:
• Age of employee: 27
• Date of joining: May 2022 (Qualified years of service are 35 years)
• Retirement age: 60
• Monthly Basic pay: Rs 20,000
• Existing NPS Tier 1 corpus: Rs 1.8 lakh
• Annual Basic pay growth rate: 5 per cent
• Annual DA growth rate: 3 per cent
• Expected return on investment: 8 per cent and 10 per cent
• Final Lump sum withdrawal percentage: 60 per cent
• Annuity rate after retirement: 6.5 per cent
• Life expectancy: 80 years
• Surviving spouse's life expectancy: 80 years
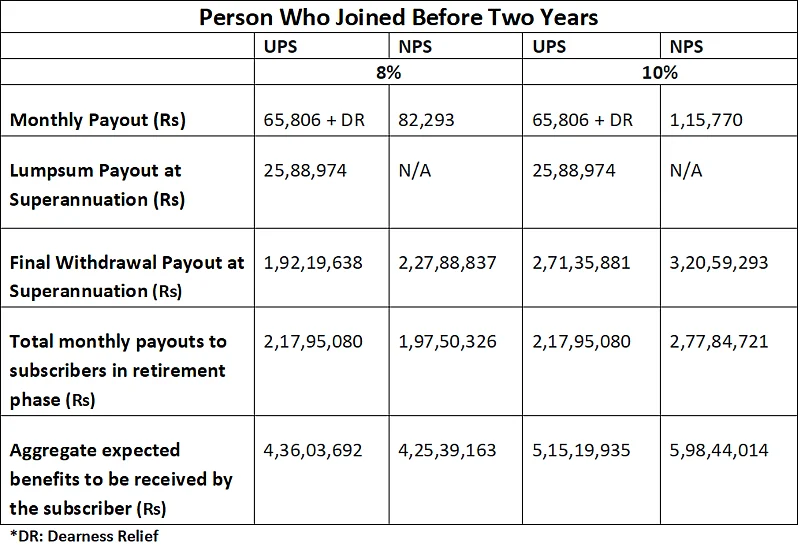
The example clearly shows that for an employee who has joined recently, the difference between the aggregate amount is lower compared to the previous example. Also, if the return on investment is higher, NPS’s return increases much faster than UPS resulting in higher aggregate benefit.


