

Summary of this article
Repo cuts affect short-term rates more than long bonds
Ten-year yields track inflation, borrowing, global risks
Policy transmission weakens steadily with longer maturities
By Rahul Goswami Chief Investment Officer & Managing Director – Fixed Income India, Franklin Templeton Asset Management (India) Pvt Ltd
In India’s monetary policy discussions, the repo rate often grabs headlines. It’s the Reserve Bank of India’s (RBI) benchmark policy rate, signaling its stance on liquidity and growth. When the RBI cuts the repo rate, the expectation seems simple: borrowing costs fall, credit expands, and long-term yields - like the 10-year Government of India (GOI) bond yield—should decline.
But history tells us a different story. The link between repo rate cuts and long-term yields is neither linear nor guaranteed.

Why Repo Rate Cuts Matter
The RBI follows a flexible inflation-targeting framework, balancing price stability with growth. When inflation moderates and growth risks emerge, repo rate cuts are a natural policy response. Lower repo rates reduce short-term borrowing costs, support consumption and investment, and ease debt-servicing burdens for corporates and households.
Repo Cuts Automatically Lower Long-term Yields is a Myth
While repo cuts influence short-term rates—like overnight call money and treasury bills—their impact on the 10-year G-Sec yield is far less predictable.
Why? Because the 10-year yield reflects more than just the policy rate. It is shaped by:
Inflation expectations and risk premium
Government borrowing program (expected trends in fiscal deficits)
Global factors (US Treasury yields, oil prices, Emerging Market risk sentiment)
Domestic technicals & Regulatory changes (Liquidity Coverage Ratio norms, insurer demand, RBI’s open market operations)
These structural drivers often overshadow repo signals, making the long end of the curve less sensitive to policy changes.
What History Tells Us
Across five easing cycles since 2008 (see table):
Repo cuts ranged from 125–425 bps.
The 10-year yield fell only modestly—by an average of ~9 bps—and even rose in two episodes.
During tightening phases, long yields declined in 3 out of 5 periods, despite hikes of up to 375 bps.
The correlation between repo changes and 10-year movements is low at just ~0.28, with a negligible regression slope (~0.04 bps change in 10-year yield per 1 bps repo rate change).
| From Date | To Date | Period (Days) | RBI Policy Action | Cumulative Rate Action (bps) (A) | 10 Year Beginning | 10 Year End | Total 10 Year Change (bps) (B) | Monetary Policy Rate Transmission Rate (B/A) |
| 26-Oct-05 | 11-Oct-08 | 1081 | Increase | 300 | 7.14 | 7.70 | 56 | 19% |
| 20-Oct-08 | 27-Feb-10 | 495 | Decrease | -425 | 7.70 | 7.85 | 14 | 10% (10 Year Rose) |
| 19-Mar-10 | 10-Mar-12 | 722 | Increase | 375 | 7.85 | 8.46 | 61 | 16% |
| 17-Apr-12 | 15-Jul-13 | 454 | Decrease | -125 | 8.46 | 8.19 | -27 | 21% |
| 20-Sep-13 | 09-Aug-14 | 323 | Increase | 75 | 8.19 | 7.77 | -42 | 10% (10 Year Fell) |
| 15-Jan-15 | 14-Oct-17 | 1003 | Decrease | -200 | 7.77 | 7.83 | 6 | 10 Year Rose |
| 06-Jun-18 | 05-Jan-19 | 213 | Increase | 50 | 7.83 | 7.36 | -48 | 10 Year Fell |
| 07-Feb-19 | 08-Apr-22 | 1156 | Decrease | -250 | 7.36 | 7.12 | -24 | 10% |
| 04-May-22 | 28-Dec-24 | 969 | Increase | 250 | 7.12 | 6.66 | -46 | 10 Year Fell |
| 07-Feb-25 | 05-Dec-25 | 301 | Decrease | -125 | 6.66 | 6.49 | -16 | 13% |
With liquidity conditions evolving and credit growth showing signs of moderation, concerns around the effective transmission of monetary policy have intensified. An analysis of yield movements over the past year reveals that transmission has been pronounced at the shorter end of the curve, with effectiveness diminishing as maturities lengthen.
Policy Transmission Has Been Strongest At The Short End
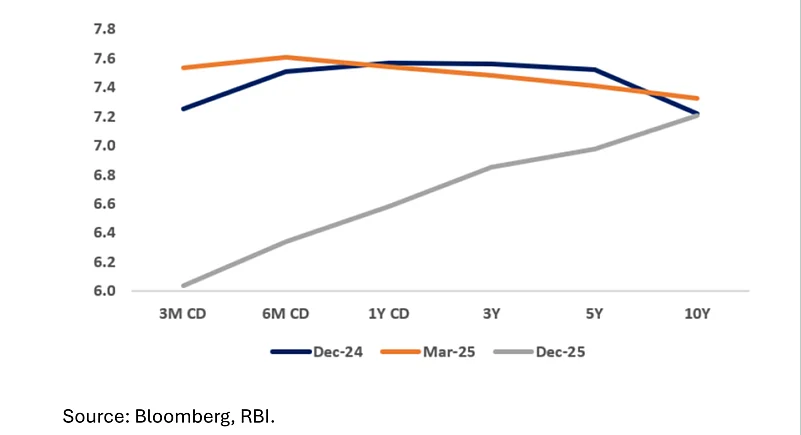
Thus, a reduction in repo rates does not necessarily ensure similar movement on long-term bond yields. During easing cycles, the yield curve often steepens, with yields on short-term instruments rallying more than those at the long end. Also, the RBI exerts greater influence over shorter-term bonds compared to longer-term bonds. This is why bond markets are segmented by duration.
For debt investors, policy signals should be considered as one factor among many when devising duration strategies. An effective approach requires evaluating inflation expectations, RBI’s liquidity operations, borrowing schedules, trends in fiscal deficits, risk premiums, global yields, and other variables rather than just repo rate signals.
The information contained in this presentation is not a complete representation of every material fact regarding any industry, security, or the fund, and is neither an offer for units nor an invitation to invest. This communication is meant for use by the recipient and not for circulation/reproduction without prior approval. Statements/ opinions/ recommendations in this document, which contain words or phrases such as “will”, “expect”, “should”, “believe” and similar expressions or variations of such expressions, are “forward-looking statements”. Actual results may differ materially from those suggested by the forward-looking statements due to risk or uncertainties associated with our expectations with respect to, but not limited to, exposure to market risks, general economic and political conditions in India and other countries globally, which have an impact on our services and / or investments.
The sector/stocks/securities mentioned in the material (to be changed according to the context of communication) may not be considered as investment advice or recommendation to buy or sell, nor a view or opinion on quality or profitability, providing a basis of investment decision in the same. The schemes managed by Franklin Templeton Asset Management (India) Pvt. Ltd (the AMC) may or may not have any future exposure in the same. The reader should not assume that investment in the sector/stocks/securities mentioned was or will be profitable. Information is historical and may not reflect current or future portfolio characteristics. Past performance does not guarantee future results.
The views expressed by the portfolio managers are based on current market conditions and information available to them and do not constitute investment advice. The views expressed herein are based on the basis of internal data, publicly available information & other sources believed to be reliable. Any calculations made are approximations meant as guidelines only, which need to be confirmed before relying on them. These views alone are not sufficient and should not be used for the development or implementation of an investment strategy. It should not be construed as investment advice to any party. All opinions and estimates included here constitute our view as of this date and are subject to change without notice. Neither Franklin Templeton Group nor any person connected with it takes any responsibility and assumes no liability for any error/omission or accuracy of the information. The recipients of this information may take professional advice before acting on this information. Please read the Scheme Related Documents carefully in its entirety prior to making an investment decision. For details, please refer www.franklintempletonindia.com.
Mutual Fund investments are subject to market risks, read all scheme related documents carefully.
(Disclaimer: Views expressed are the author’s own, and Outlook Money does not necessarily subscribe to them. Outlook Money shall not be responsible for any damage caused to any person/organisation directly or indirectly.)


