
Credit it to the Mutual Funds Sahi Hai campaign or the rising equity culture in India, mutual fund systematic investment plans (SIPs) are continuously breaking the popularity charts in the Indian investment landscape.
The numbers prove it. Data from the Association of Mutual Funds In India (Amfi), as of November 2025, shows that there are more than 80 million SIP accounts in India and the total assets under management (AUM) for SIPs has climbed to Rs 16.52 lakh crore, more than half of all assets held by equity-oriented mutual funds. Equity-oriented schemes themselves command a massive Rs 35.65 lakh crore in AUM.
The narrative in investor seminars and even YouTube explainers has helped build that credibility: SIPs bring discipline as they are automated and effortless, they protect you from volatility, and the equity variants ensure inflation-beating returns, and they are capable of turning even the most inconsistent saver into a long-term wealth creator.

1 June 2026
Get the latest issue of Outlook Money

But are SIPs really the miracle pill for wealth creation? The truth is more complicated which is often not a part of the popular narrative. That SIPs always deliver tidy, double-digit returns is an illusion that people often fall for. They don’t.
For instance, anyone investing in mid- and small-cap funds by way of SIPs between September 2014 and August 2019, a five-year stretch, likely ended up with negative returns. Even the Nifty 50 SIPs during the same period delivered only about 7.10 per cent, according to data from Accord Fintech.
That’s not to say that SIPs don’t work for you or are flawed. But SIPs are true to their potential only when the investor works with them. Here are some factors that can act like drawdowns, and how investors can navigate around them.
The 12% Return Illusion
If there is one number that has shaped the Indian investor’s imagination, it is “12 per cent” return on mutual funds. Every goal calculator, YouTube video, or influencer chart seems to default to this figure for SIP returns. Retirement at 60? Assume 12 per cent. Child’s education? Assume 12 per cent. Dream home? Assume 12 per cent.
But when you look at the actual returns, you realise that some funds may generate more, some less, and nearly all their returns fluctuate based on when you start and how long you stay invested. Flexi-cap funds, over the last five years, for instance, show SIP return ranges from about 9.68-21.63 per cent, an enormous spread. Yet most investors plan life goals assuming uniform, linear 12 per cent returns. Similarly, for mid-cap funds, SIP returns are in the range of 13.45-24.55 per cent over the five-year period, according to data from Accord Fintech.
What Should You Do? Aditya Agarwal, co-founder of Wealthy.in, a wealth management platform, believes investors underestimate the variability built into markets. “Historically, about two out of every three five-year periods for Nifty 50 TRI have ended with more than 12 per cent return per annum. Keeping that in mind, the assumption of generating 12 per cent annual return from long-term SIPs does not seem far-fetched,” he says.
But treating it as a promise is risky. Instead of 12 per cent, Akshat Garg, head of research and product at Choice Wealth, a wealth management platform suggests investors to plan with the following return bands: a conservative 6-8 per cent, a base case of 9-12 per cent, and anything above 12 per cent only if you consciously take higher risk.
“Always stress-test goals with lower-return scenarios. Adjust SIP amount, horizon or risk accordingly,” he says. This would help prepare for the years when returns fall short, so your financial goals stay on track even when the market doesn’t work in your favour.
Early Or Panic Exits
Often, investors don’t earn what their funds earn. While investors obsess over, “which fund will give 15 per cent or higher returns”, the bigger problem often lies elsewhere—in how investors behave with those very funds.
Amfi data reveals that as of March 2025, on an average, only 33 per cent mutual fund investors had an average investment holding period of more than five years in regular plans. In direct plans, the number dropped to 19 per cent over the same period. The most worrying part was that 64 per cent investors in case of regular plans and 48 per cent in case of direct plans exited their investments in just two years.
A shorter investing period can hurt investors. As an asset class, equities are expected to offer decent inflation-beating returns over the long term. But when the investing momentum breaks midway, those long-term returns are not only disrupted, they often never materialise at all.
Says Garg: “Holding for two years turns a long-term engine into short-term turbulence. You crystallise losses, miss recoveries, and break the compounding cycle—the invisible multiplier of wealth.”
Most of these exits happen during downturns, when headlines overwhelm discipline. For instance, investors who pulled out during the Covid crash, between February and March 2020, ended up missing one of the sharpest rebounds in recent market history, after falling 37 per cent in a single month.
On the other hand, the Nifty 50, which tracks India’s 50 largest companies, climbed 136 per cent from the end of March 2020 to mid-November 2021. Those who exited in panic lost the chance to benefit from that recovery (see Early Exit… Hurts Investors).

Short-term volatilities, Agarwal says, look like negligible dips when looking at long-term returns. “Not staying invested long enough often results in less than expected returns or even loss of capital.” The only antidote, he says, is patience, something that SIPs cannot automate.
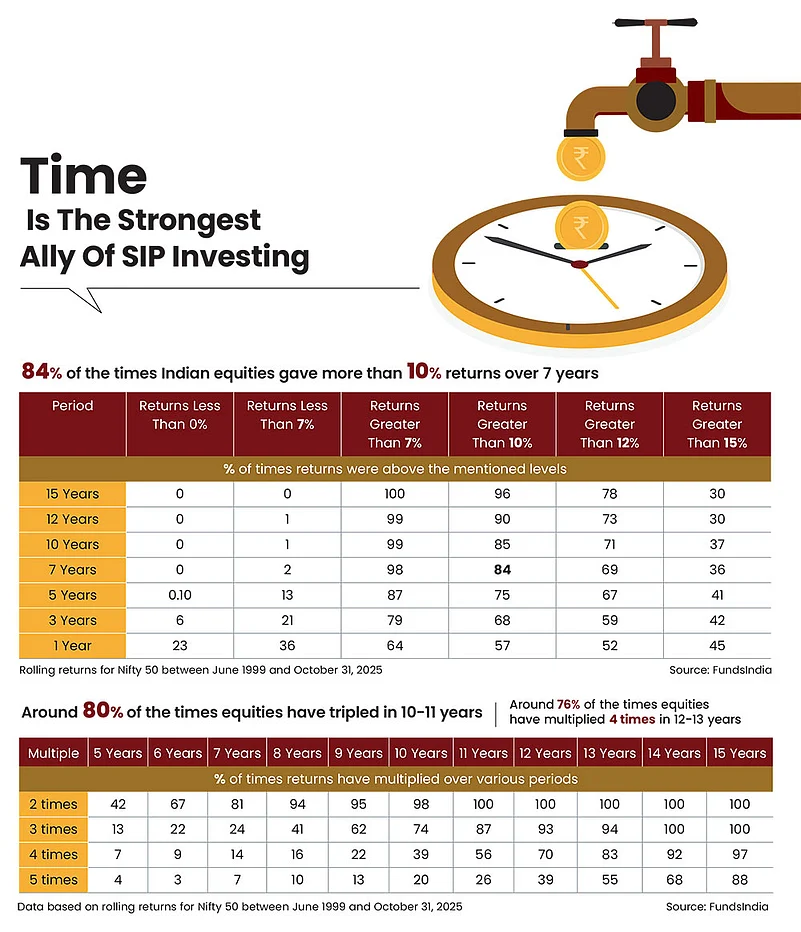
Market history supports this argument unequivocally. Historical data shows that the Nifty 50 has delivered more than 10 per cent returns over seven-year periods nearly 84 per cent of the time. Over 10-11 years, Indian equities have tripled wealth around 80 per cent of the time.
What Should You Do? They say you can never predict the markets and that’s absolutely true. So, if the year in which investors plan to make a withdrawal coincides with a stagnant or bearish market, they may end up losing.
For instance, those who didn’t withdraw during the Covid crash because of panic, but because one of their goals coincided with the period, would have lost a substantial amount of money. That is why the correct strategy is to move your money out of equities when you are closer to your goal. You could start doing that systematically through systematic withdrawal plans (SWPs) of mutual funds a year or so before the goal approaches.
However, if you don’t need to withdraw during such a period, extending the horizon by a few more years can solve the problem.
Equities are expected to offer inflation-beating returns over the long term. But when the investing momentum breaks midway, long-term returns are disrupted
How does that happen? “The best days of returns come after the days when markets stumble the most,” says Abhishek Tiwari, CEO, PGIM India Asset Management. Since 2001, Tiwari explains, some of the market’s best days (regarding daily returns) occurred either during a correction phase or shortly after that. “It’s intuitive to think that markets bounce back stronger after a downturn,” he adds.
Going by historical data, almost 30 of the 50 best days in the last 24 years were after a market correction. “A significant chunk of these best days occurred during major crises like the global financial crisis (2008-09) and the Covid-19 crash (2020),” says Tiwari.
Missing just a few of these days can have a big impact on your money in the long run. At the same time, timing the market is incredibly difficult, says Tiwari, not just in predicting the best days, but also the worst ones. He says: “This isn’t just a local trend; it holds across global markets. More often than not, it is our behaviour, our ability to stay invested through volatility that determines long-term returns, rather than attempting to time the market or chase the next multi-bagger stock.”
So, the next time markets stumble, remember that time is the strongest ally of SIP investing, but only if investors let time do the heavy lifting.
Chasing Last Year’s Winners
Another silent killer of SIP returns is performance chasing. Many investors pick a mutual fund by simply checking the past one-year returns and choosing whatever is topping the charts.
Agarwal warns that this is one of the most common traps. “Chasing last year’s top performers is not a great idea. Some of these funds slow down when valuations stretch, assets swell, or cycles turn. So, the ranking methodology, market outlook, everything matters.”
What Should You Do? Choose funds by process consistency, manager tenure, downside behaviour and rolling returns; match the fund to your goal and risk capacity. That discipline improves long-term outcomes.
“To check for consistency of performance, investors should check the fund’s rolling returns which gives a clear picture of performance across various market conditions, revealing consistency and volatility,” says Tiwari.
Rolling returns are the average of a series of returns over a long period of time. Rolling returns can help you identify the funds that have delivered good returns on a consistent basis or have been able to sail through all types of market cycles without much volatility.
Look at the annual performance of the funds as well. This can help you understand how the fund has fared through different market cycles, to some extent.
Giving In To Stagnancy
Even investors who choose good funds and stick to them long enough fall prey to a subtle, but devastating mistake—failing to increase SIP amounts. As incomes rise, lifestyles expand. But what about investments?
Imagine someone investing `5,000 a month for retirement when earning `40,000 a month. But a decade later, when the salary increases and perhaps doubles, the SIP amount remains at `5,000. Typically, people upgrade the restaurants they visit, the vacations they take, and the wardrobes they have, but forget to increase the savings proportionately.
The mismatch eventually shows up at retirement, when the lifestyle expenses have grown exponentially, but the underfunded corpus is not enough to support it.

What Should You Do? Upgrade your SIP amount in sync with your increasing earnings and expenses. Such increases are a pocket-friendly way to meet your long-term goals.
One way to do it is through step-up SIPs. These SIPs allow you to automatically increase the investment amount at regular intervals, say, every year, by a pre-decided amount or percentage of the SIP contribution.
A step-up SIP can give a big boost to your corpus. A monthly SIP of Rs 10,000 at 12 per cent for 20 years will grow to Rs 92 lakh; a 10 per cent increase will take it to Rs 1.86 crore
The difference a step-up SIP makes is huge. A Rs 10,000 monthly SIP that stays flat for 20 years at 12 per cent creates around Rs 92 lakh. But an SIP whose amount is increased by 10 per cent every year crosses Rs 1.86 crore, which is more than double the amount compared with a stagnant SIP.
“Step-ups convert rising income into more invested capital and dramatically lift terminal wealth. Automated 5-15 per cent annual increases are practical and sustainable,” says Garg.
Remember that compounding doesn’t just work on returns, it works on contributions too.
For all their imperfections, SIPs remain one of the most powerful tools for ordinary Indians to build financial security. They need patience, realistic expectations, an evolving contribution rate, and regular review, not blind faith. As equity data across decades shows, volatility is never permanent, declines are temporary, recoveries are powerful, and time smooths out most anxieties.